Thursday, May 8, 2008

Hangseng Index: Watch Out For Bullish Morning Star

I issued an alarm (refer to my Sunday post on Hangseng Index label) that Hangseng looks exhausted and it will be prudent for traders to cash in on gains, last Tuesday was an opportunity to do that when Hangseng was modestly up 78.2 points.


Asian stocks including Hangseng Index tracked Wall Street's fall and traded lower on Thursday and closed down 160.42 points or 0.6 percent at 25,449.79, losses were however capped by Shanghai's 2.17% gains.
Technically, the market today formed a 'star position' and traders are advised to be on the look-out for potential bullish morning star (this is a candlestick formation of long black candle followed by a small doji and a long white candle); a white candle tomorrow will confirm this formation (preferably the white candle will be supported by strong volume somewhere in the vicinity of HKD 80B of value traded). In this event, Hangseng Index will be ready to take-out 26,390 recent resistance and take-on 27,000.


Sunday, May 4, 2008

Dow Jones Index: Look Back At 8 Years Time Line

The best compass for the future is the past and the best way not to get lost on a trail is to constantly review the road map and to familiarize the terrain; therefore, let us travel 8 years back and study key paths the index has navigated so far.


The last US recession in 2001 we saw Dow Jones Index dropped 39.70% from its 2000 peak and the downtrend lasted 2.5years before the market recovered and went on a 4.5years bull run (FED Funds Rate then touched historic low of 1.00%). Good times don’t last forever and so the recent bull run reached its’ climax last October 2007.

The index suffered its’ deepest correction in 4 years when the market broke down from its’ bearish Head & Shoulder Pattern and consequently broke down from its’ major support trend line. However, the deep correction failed to penetrate through 2000 key historic high of 11,900 which served as the index first wall of concrete support, that level proved to be a stronghold as the index rallied from there and climbed back above its’ trend line, then the market regained 12,700 key level by knocking out its’ H&S Neckline Resistance, the index paused and consolidated a bit above the neckline before it jumped above 13,000 psychological level and closed the week at that level.

THE TERRAIN AHEAD

Looking at the chart, the index don’t have decisive resistance left in its’ way except for some pockets of potential obstacles: first is 13,200 level followed by Dec ’07 peak of 13,850 and lastly its’ all time high of 14,280. But this doesn’t mean the index will immediately take on these obstacles with the exception of the first obstacle as the market came a whisker close to 13,200 level last Friday’s intra-day high. As a matter of fact, traders should be on the alert of a possible strong pull back of the index to re-test 12,700 support level and it is very important for this support to hold for the index to rise further; otherwise, a broke below 12,700 support will mean a failed break-out of this key neckline resistance.


MARKET EXHAUSTION

6 out of the last 10 trading days, the index closed near its’ intra-day low this implies market exhaustion especially after its’ 2 months long rally. Moreover, looking at the chart more closely, the market could be developing a ‘rising wedge area pattern’ though it’s too early to conclude on this pattern hence further confirmation maybe warranted. Nonetheless, traders should be on the look-out for early signals of potential candlestick reversal patterns considering a re-test of 12,700 is imminent regardless of the purpose: whether to confirm a valid break-out of the index from 12,700 neckline resistance, or a set-up for further up trend to take-on the three potential obstacles.


US DOLLAR: Is It Time To Buy Dollar?

The 6 long years of continues depreciations of the US Dollar has pushed the greenback to the backstage allowing the Euro and the commodities to take the spotlight; as the greenback lost its’ value and appeal investors flew to other asset classes to hedge the falling dollar. However, for the past weeks there were evidenced of scalpers picking up the battered green currency and investors starting to notice the US Dollar coming to life again. Still, others believe the rebound could be short-lived. Let us look at the widest time frame available for the US Dollar Index to try to determine where the Dollar is headed.


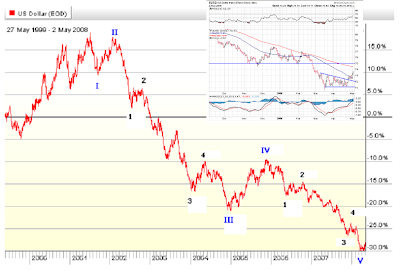
Looking at the 9 years chart of the US Dollar Index, the Dollar fall off the cliff when it broke down from its’ bearish head & shoulder pattern last mid 2002, the downward momentum that followed the break down was quite strong which is a typical characteristic of a Wave III; the dollar recovered early 2005 but the rally lasted for a year only; interestingly, the index formed a smaller head & shoulder pattern during these rally, the Dollar once more broke down from this bearish pattern and the downward momentum accelerated again, the difference between this downtrend from the preceding downtrend was the evidence of a sort of ‘capitulation’: for a month or so, the 71 level was severely tested (refer to upper right portion of the chart) but it was not broken this could be because “shorters” were no longer too aggressive or eager in pushing down the Dollar further; moreover, notice that the recent consolidation was preceded by a larger consolidation pattern (Dec ’07 to Feb ’08), consolidation after consolidation only occurred on extreme exhaustion, compared with bottom of wave III there were no consolidation patterns but only sharp rallies (refer to mini wave 3 to 4 of Wave III and early leg of Wave IV). Henceforth, the recent downtrend (2006 to April ’08) could be Wave V (note that capitulation normally happens on Wave V, result of over-extended or over-stretch of a trend).

COMPARING WAVE IV CORRECTIVE WAVE CYCLE WITH RECENT COUNTER-TREND MOVE

Wave IV rolled pass 2004 trough resistance but failed to break above 2003 stronger trough resistance; of the same importance, recent Dollar counter-trend move must clear its’ recent ’07 / ’08 troughs and subsequently breaks above ’05 stronger trough resistance (or bottom of Wave III) for the US Dollar to have a clear trend reversal.


CRB INDEX: Short The Commodities

The strength in the US Dollar has an inverse effect to the commodities as investors flee from what is widely perceived as ‘safe heaven’ back into equities and the greenback; these are natural cycles in the financial markets. Whether the decade bull market run on the commodity market is coming to an end or not is too far for my telescope to reach but on the near term horizon the commodity index is clearly forming a bearish double top reversal pattern and its’ RSI negative divergence confirms this bearish top pattern.


A breakdown from this double top coupled with a bearish cross-over of its’ MACD below centerline presents ‘shorts trading opportunities’. The index first wall of support is its’ 2006 historic high which looks tough for the market to penetrate on first attempt hence it may be prudent for traders to cover short positions near this level; however, a break down from this support will accelerate the downtrend.


10yrs TREASURY YIELD: Biggest Rise in 48 Months

The Benchmark 10-year Treasury note yielded 3.76 percent last month, up from 3.43 percent on March, this is a spread rise of 9.6% (its’ biggest rise in 48 months) all due to speculation that the Federal Reserve rate-cutting campaign might be nearing an end, this help revive the sagging dollar and fuel the strong rally in the stock market that sent Dow Jones Index sharply higher 4.5% month-on-month.

However, traders are advised against counting out a potential rebound in Treasury prices (prices and yields move in opposite direction), because technically the bond market has yet to take-out key 21 years old downward resistance line and this is a precursor to a trend change.
The recent ’03 to ’07 bull market run on Wall Street, bond yields enjoyed the same boom as it broke out from its’ 21 years old downward resistance line but during the last leg of its’ bull run it formed a small bearish double top reversal pattern. And a broke-down from this bearish top pattern ended the bond market 4 years rally and eventually sent yields back below its’ downward resistance line.
Suffice to say, traders would want to see bond yields broke above its’ historic downward resistance line and more importantly consolidate above this downward resistance before it take-on its’ double top neckline resistance. Otherwise, failure to do so may soften the rally both in the US Dollar and the stock market.


Shanghai A-share Index: After the Bubble had Burst, Will There Be A Reflation?

The long awaited bubble burst in the Shanghai Index had finally burst as the index crashed 51.16% from its’ peak to recent trough, the next question traders have in mind is does the market found a valid floor at 3,000 level? Technically, 3,000 level has a strong historical basis of a valid support for the index, this area served as the first substantial consolidation area for the index prior to its’ bubble-like vertical rise. But this level has to be re-tested to confirm a valid bottom either in two ways: first, the index dropped again at this level and rebound then we have a double bottom or the index pull back and fill the gap it made last 4/24 then we have a higher low bottom.


However, the index may not take both possibilities because on a closer look using the line chart the index actually just broke-out from a small inverted head & shoulder reversal pattern last Wednesday; therefore, a re-test and consolidation above 3,650 support is more likely.


The index may open gap up on Monday, a normal spill-over of the strong upward momentum residue left last Wednesday and jump above its’ 50days moving averages but the index has to consolidate near 3,650 to build a strong base for its’ next leg up.


Hangseng Index: Lighten Up, As The Index Approaches 27,000

Four Black Candles out of the last Six Trading Days is an early signal that buying momentum is decreasing as the index slow down as it approaches key 27,000 strong resistance; likewise, average value turn-over dropped 16% week-on-week. Moreover, Hangseng ignored Shanghai’s 4.8% gains last Wednesday when it dropped 0.60%, these are technical signs of market exhaustion; therefore, it will be prudent for traders to lighten up long positions as the index approaches 27,000 level and pocket gains made for the week.
On the other hand, in the event 27,000 resistance is taken out by the index (which is unlikely), wait for the market to successfully re-test this level before entering new long positions; otherwise, wait for the index to pull back and re-test its’ 200days moving averages. There may be some swing trades opportunities at this level because of the high probability that 200MA will hold.